
Read your results
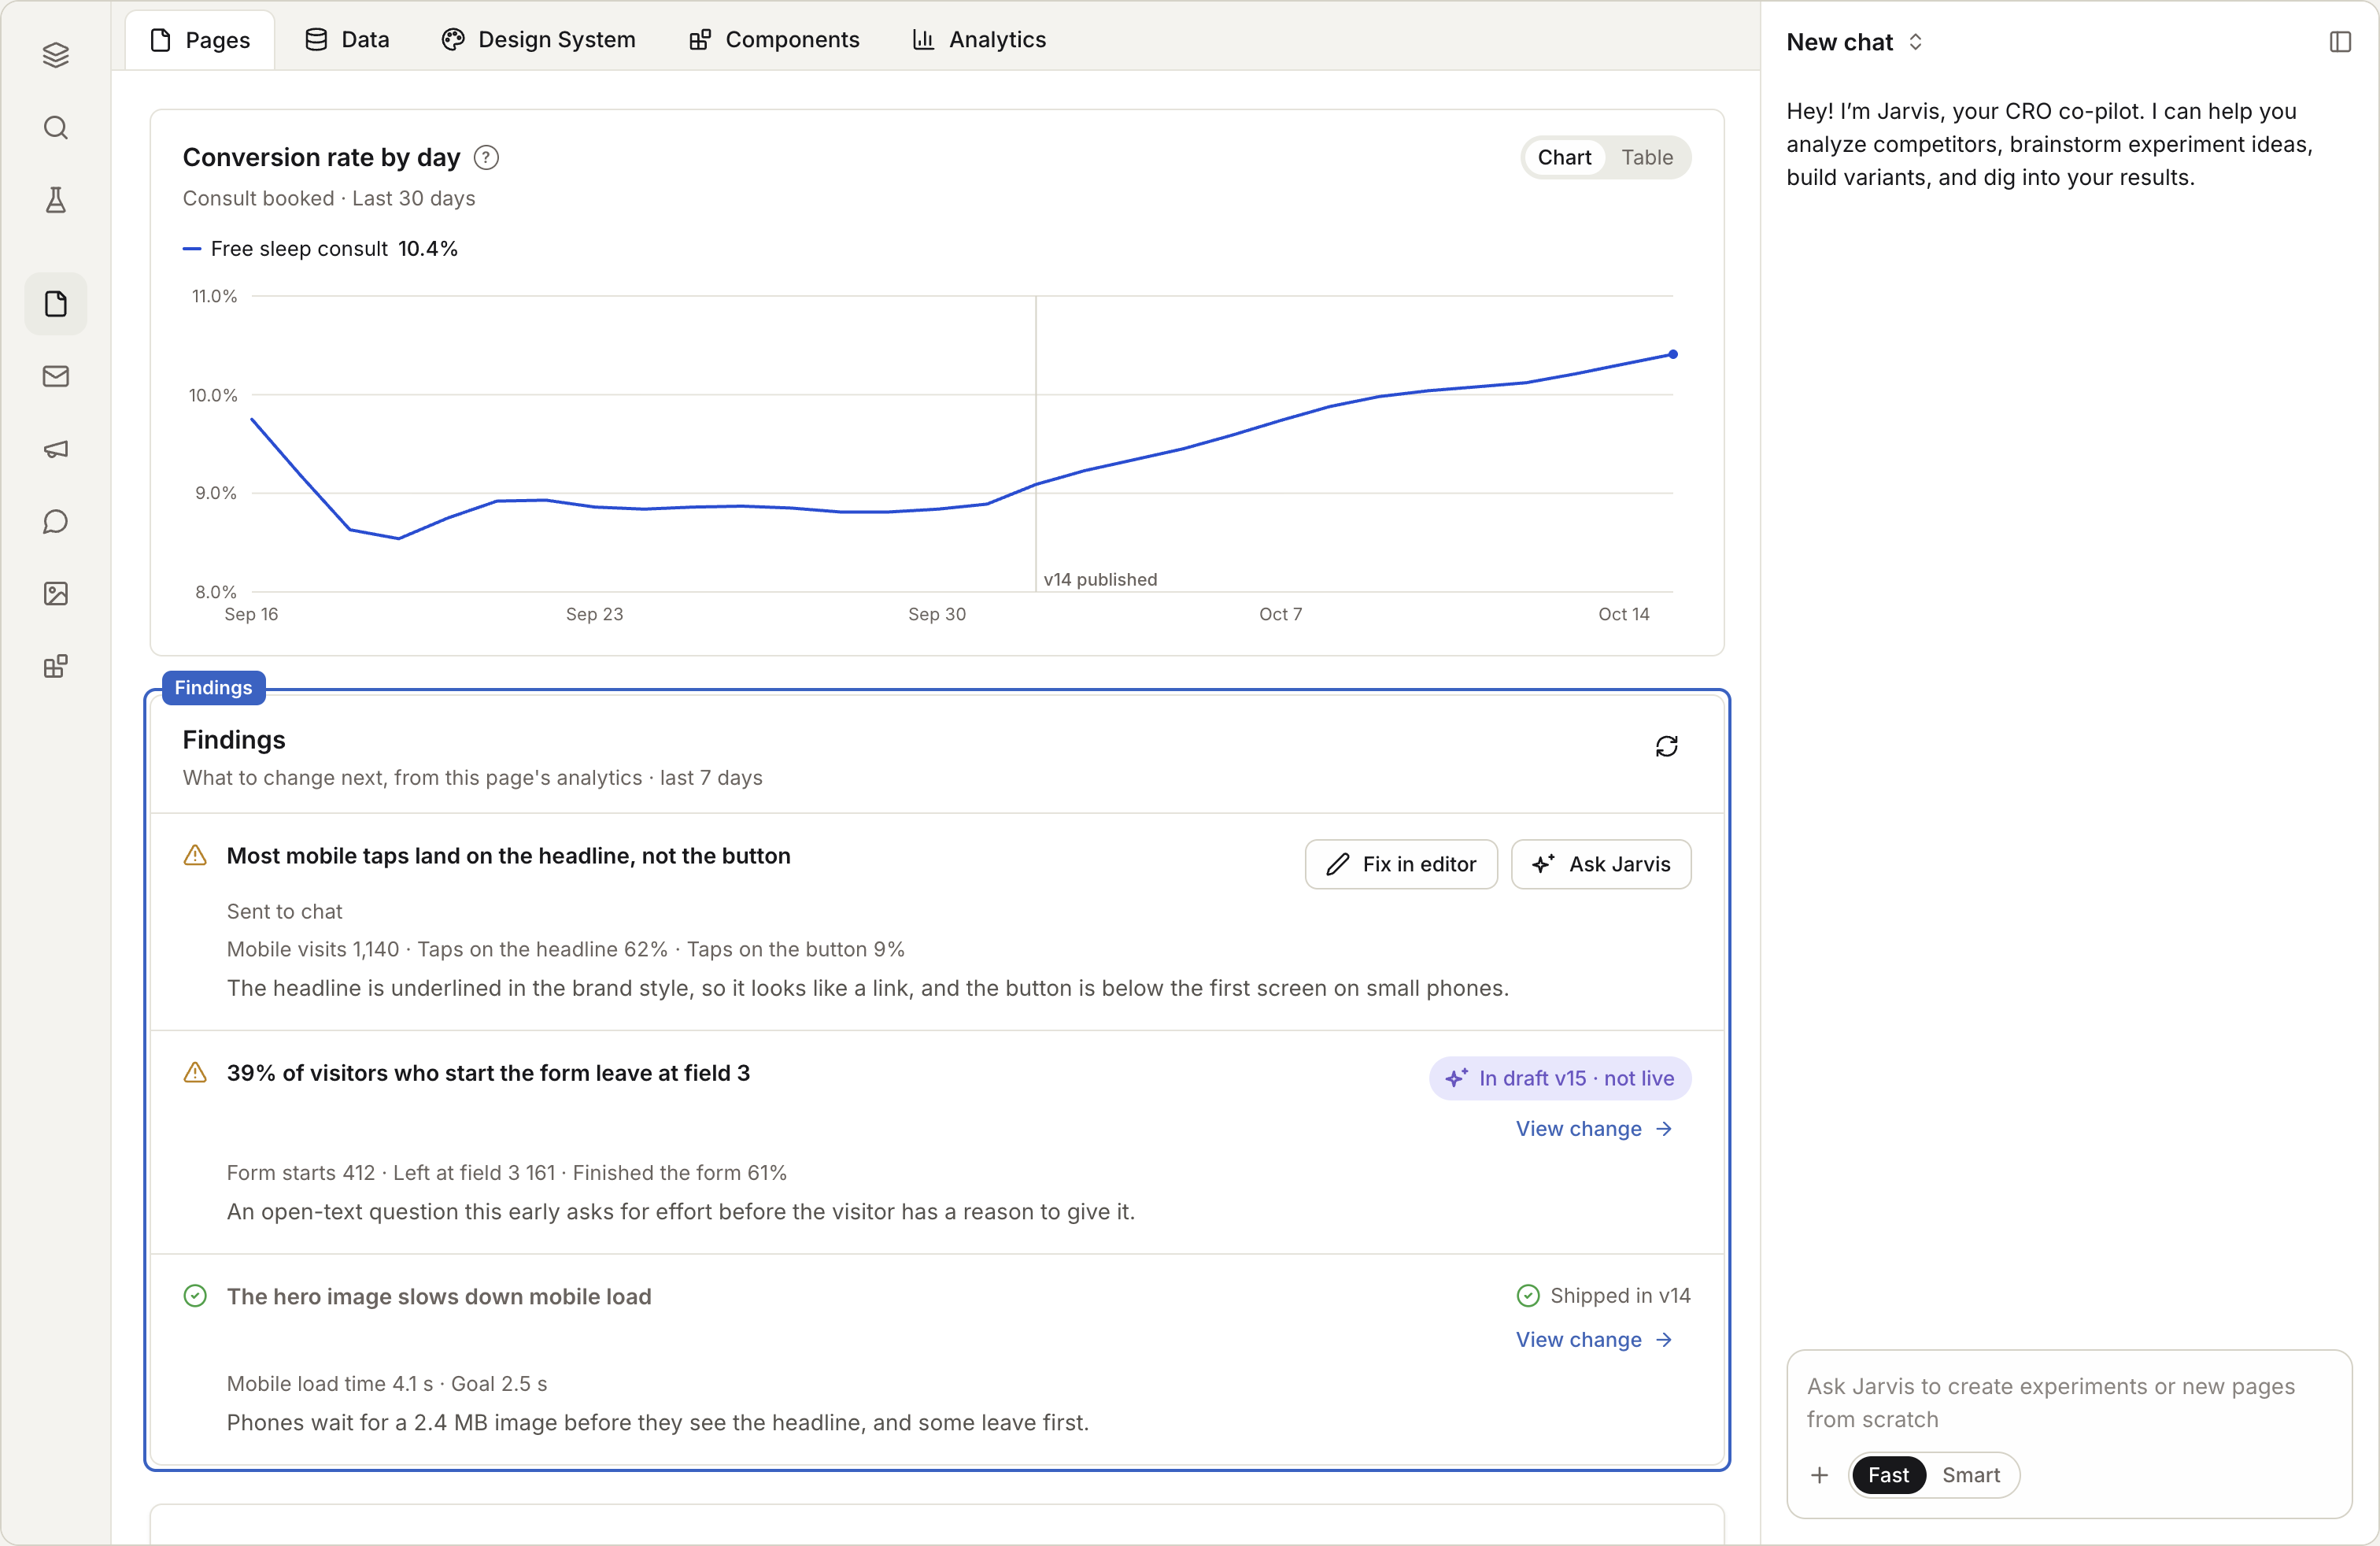
Every published page measures itself. Its Analytics view shows three things: the numbers, a heatmap, and Findings.
In this stage · 05 Measure · 0 of 3 done
Before you start
Quick version
The page › Analytics → the numbers → Open heatmap → Findings.
Steps
Step 1 · In the page or Landing Pages
Open a page's analytics
Open the page and switch from the editor to Analytics. Or open the Analytics tab in Landing Pages and pick the page.
Step 2 · In Analytics
The numbers
Visitors, conversions and conversion rate. If the page has a test, each variant gets its own row.
Step 3 · In Analytics
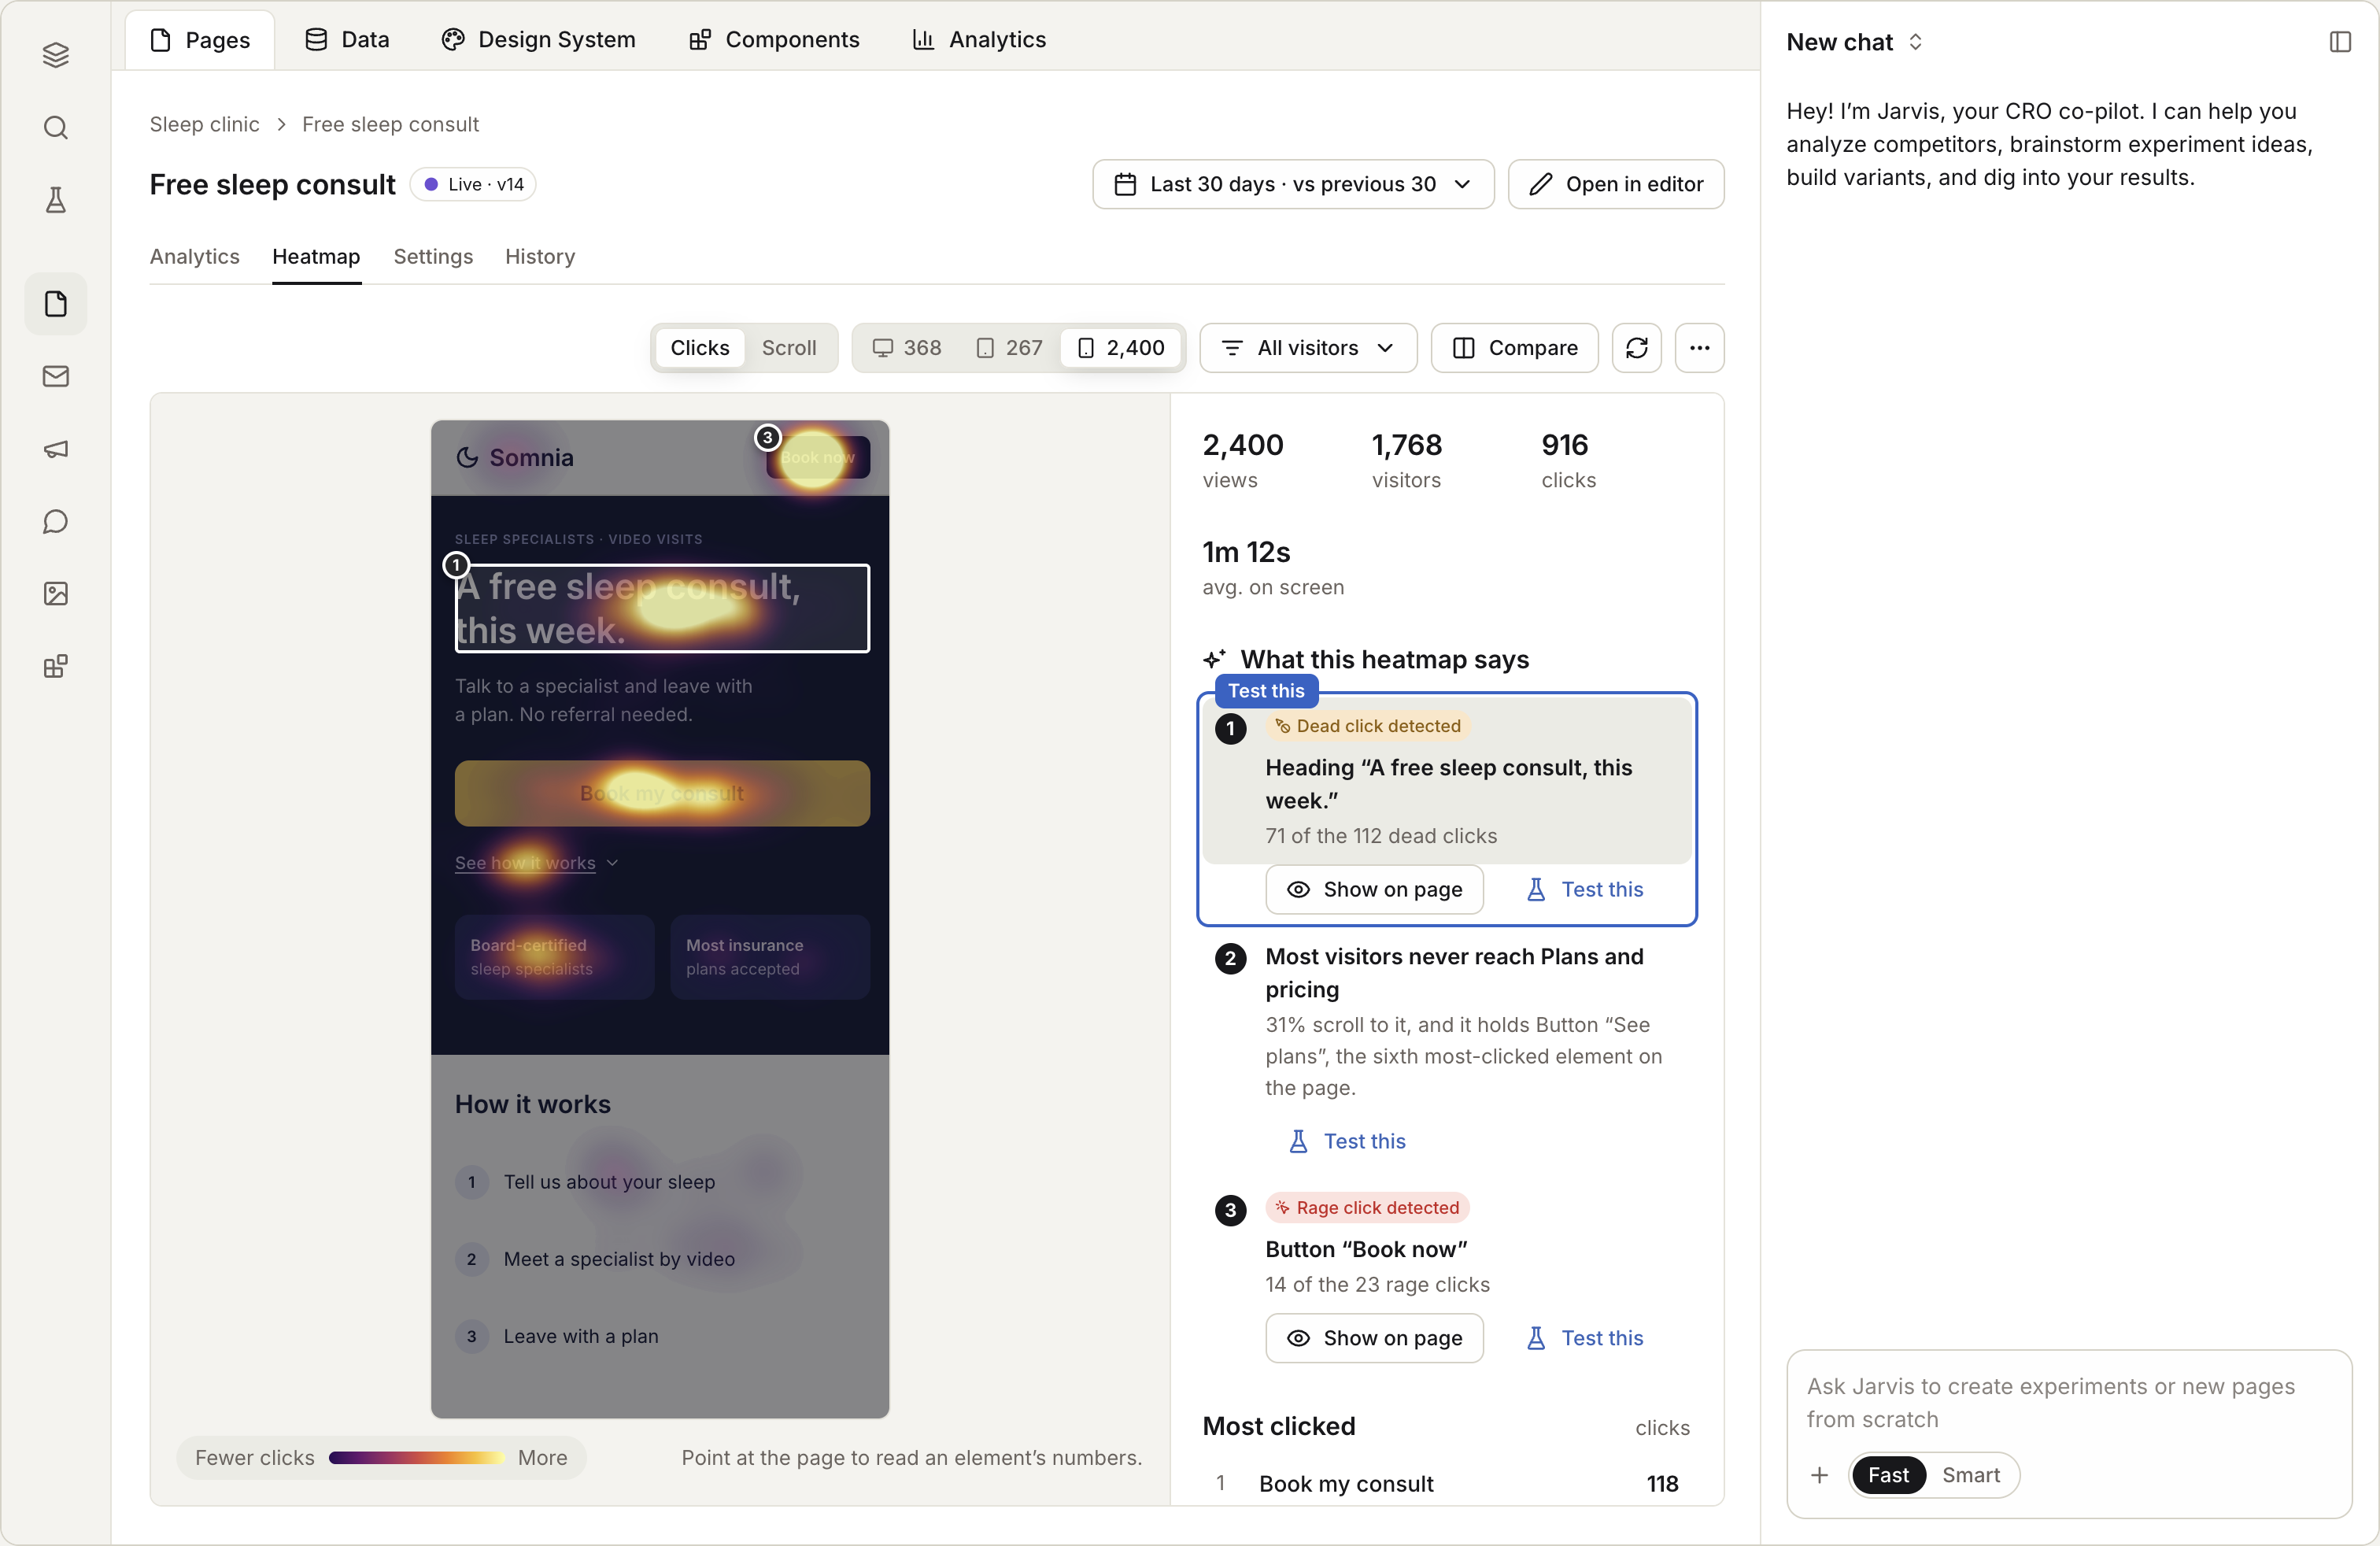
The heatmap
- Choose Open heatmap.
- See where visitors click and how far they scroll.
- Switch between phone and desktop. Visitors behave very differently on each.
- Choose Watch sessions to see recordings of real visits.
Step 4 · In Analytics
Findings
Findings is "what to change next, from this page's analytics." Jarvis, Coframe's assistant, compares the last seven days with the seven before. Each finding shows its evidence.
- Fix in editor takes you to the page with the finding ready for the chat.
- Ask Jarvis sends it to the chat, and Jarvis drafts the change.
- The finding then shows its path: Sent to chat, then In draft, then Shipped.
Check it worked
Good to know
- New pages are quiet. Findings need a week or two of visitors to say anything useful.
- Numbers start at the first visit after you publish to production. Staging visits don't count.
Last lesson in this stage · Next stage
06 Decide
Keep the winner, put it on many pages, or send each segment its own page.